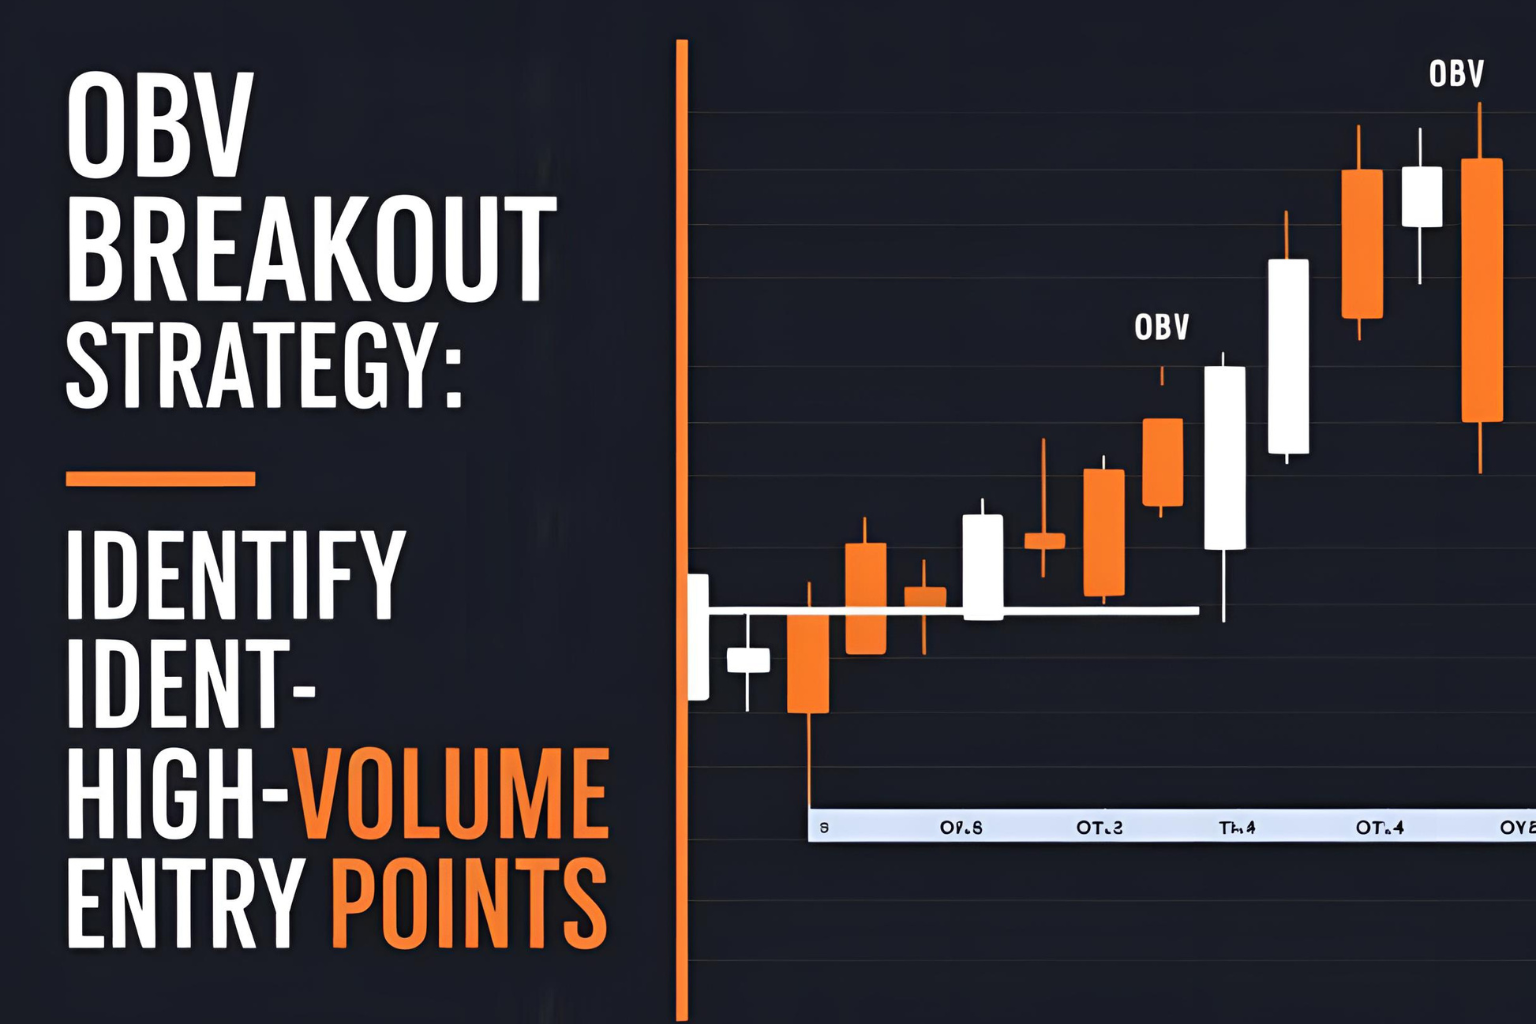
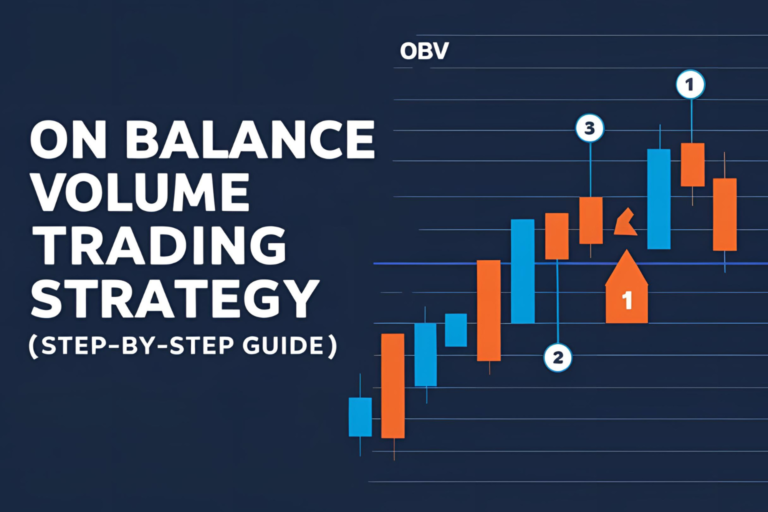
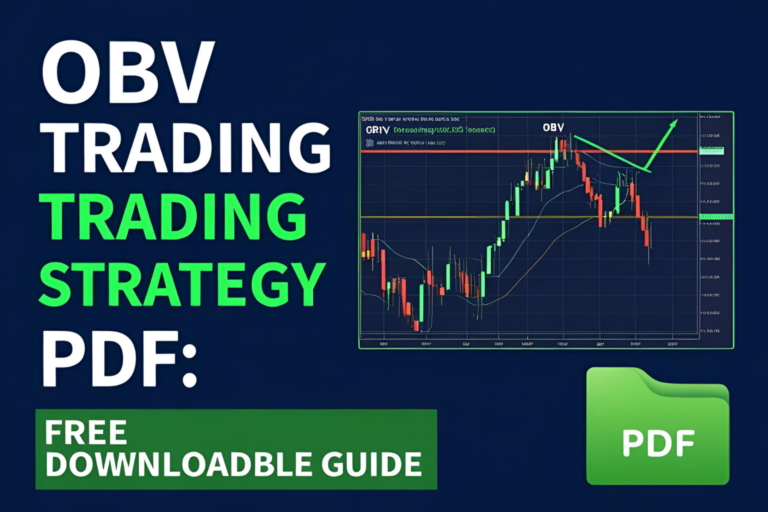
OBV Breakout Strategy: Identify High-Volume Entry Points
When price breaks a resistance level with volume support, it’s often the start of a powerful move. The OBV breakout strategy helps you spot these early opportunities by detecting volume pressure building up before price action confirms.
In this post, you’ll learn how to identify breakouts using OBV and enter with higher conviction—before the crowd reacts.
Why Use OBV for Breakouts?
Most breakout failures happen due to lack of volume. OBV solves this by:
- Showing whether a breakout has volume confirmation
- Identifying hidden accumulation before a breakout
- Detecting false breakouts when price moves without OBV support
Step-by-Step OBV Breakout Strategy
1. Mark Key Resistance or Support Zones
Look for:
- Flat resistance levels with multiple rejections
- Horizontal support areas in downtrends
- Use price action or swing highs/lows to draw levels
2. Plot OBV on the Chart
Make sure OBV is:
- Trending upward near resistance (bullish breakout)
- Trending downward near support (bearish breakout)
- Or breaking its own OBV trendline ahead of price
3. Watch for Early OBV Breakout
Often, OBV will break above its previous high before the price does. This indicates:
“Smart money is entering before the breakout.”
This is your early signal to prepare for entry.
4. Entry Signal
Enter when:
- Price breaks out of resistance with OBV already rising or breaking out
- OR price breaks out and OBV spikes simultaneously
Pro Tip: Use a candle close above the breakout zone, not just a wick.
5. Stop Loss & Target
- Stop Loss: Just below breakout level or last minor swing
- Target: Use recent resistance zones or Fibonacci extension levels
You can also trail stop using a moving average or price structure.
Example: Bullish OBV Breakout
- Price forms resistance at $50
- OBV breaks its own prior high while price is still consolidating
- Price breaks out with volume and closes at $52
- Entry: $52
- Stop: $49.50
- Target: $58–60
OBV Breakout Strategy Works Best When:
- OBV is rising steadily, not erratic
- Breakout level is clear and tested multiple times
- Combined with candlestick confirmation (e.g., bullish engulfing)
Final Thoughts
The OBV breakout strategy helps you get ahead of false breakouts by confirming volume commitment. It’s a powerful tool to detect early institutional buying or selling—giving you cleaner entries and reduced fakeouts.
Use it with support/resistance, trendlines, and price action for best results.
FAQs
1. Is OBV breakout effective in crypto markets?
Yes. It works well as long as accurate volume data is available.
2. Should I trade the OBV breakout or wait for price confirmation?
Wait for price breakout + OBV alignment for the safest entry.
3. Can I automate this OBV breakout strategy?
Yes, platforms like TradingView allow OBV-based alerts and scripts.
4. What timeframe is best for OBV breakouts?
1H and above offer the most reliable signals.
5. What confirms a breakout is valid?
OBV rising + strong candle close above the breakout level = valid.

