What Is On Balance Volume (OBV)? Explained for Beginners
On Balance Volume (OBV) is a popular technical analysis indicator that helps traders measure momentum based on volume flow. Unlike price-only indicators, OBV uses volume changes to anticipate potential breakouts, trend continuations, or reversals.
If you’re new to trading, this guide will help you understand what OBV is, how it works, and why it matters.
✅ What Is On Balance Volume?
Developed by Joseph Granville in the 1960s, OBV is based on a simple idea:
“Volume precedes price.“
OBV adds or subtracts daily volume depending on whether the price closed higher or lower than the previous day. The result is a cumulative volume line that helps spot changes in buying or selling pressure.
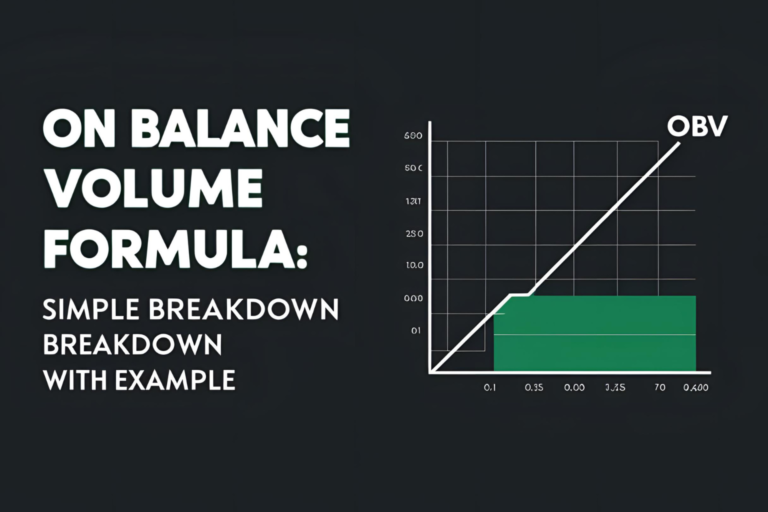
✅ How OBV Is Calculated
The formula is straightforward:
- If today’s close > yesterday’s close → OBV = OBV + volume
- If today’s close < yesterday’s close → OBV = OBV – volume
- If today’s close = yesterday’s close → OBV stays the same
This running total creates a line that traders compare to price action.
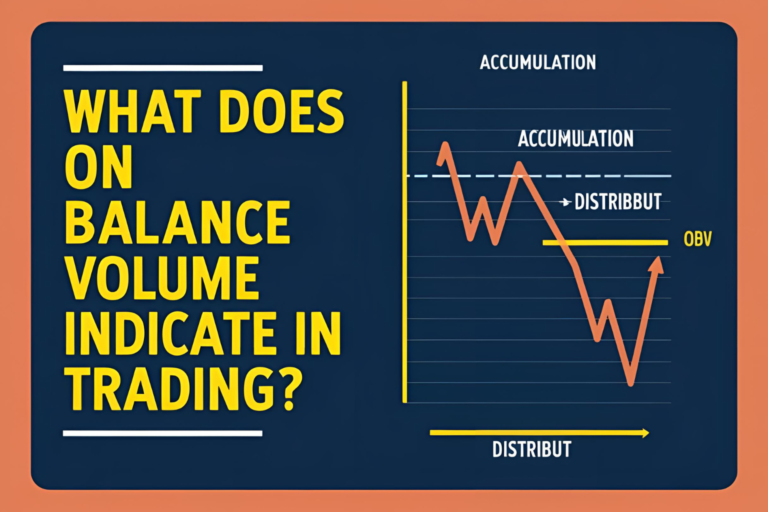
✅ What OBV Tells You
- Rising OBV: Volume is flowing into the asset (bullish signal)
- Falling OBV: Volume is flowing out (bearish signal)
- Divergence: If price is rising but OBV is falling, it could signal a potential reversal
OBV can be used to:
- Confirm trend strength
- Spot breakouts early
- Identify bullish or bearish divergences
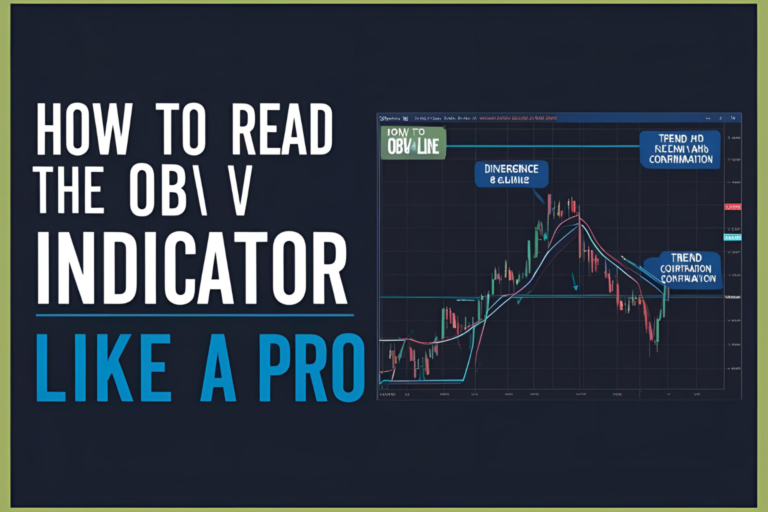
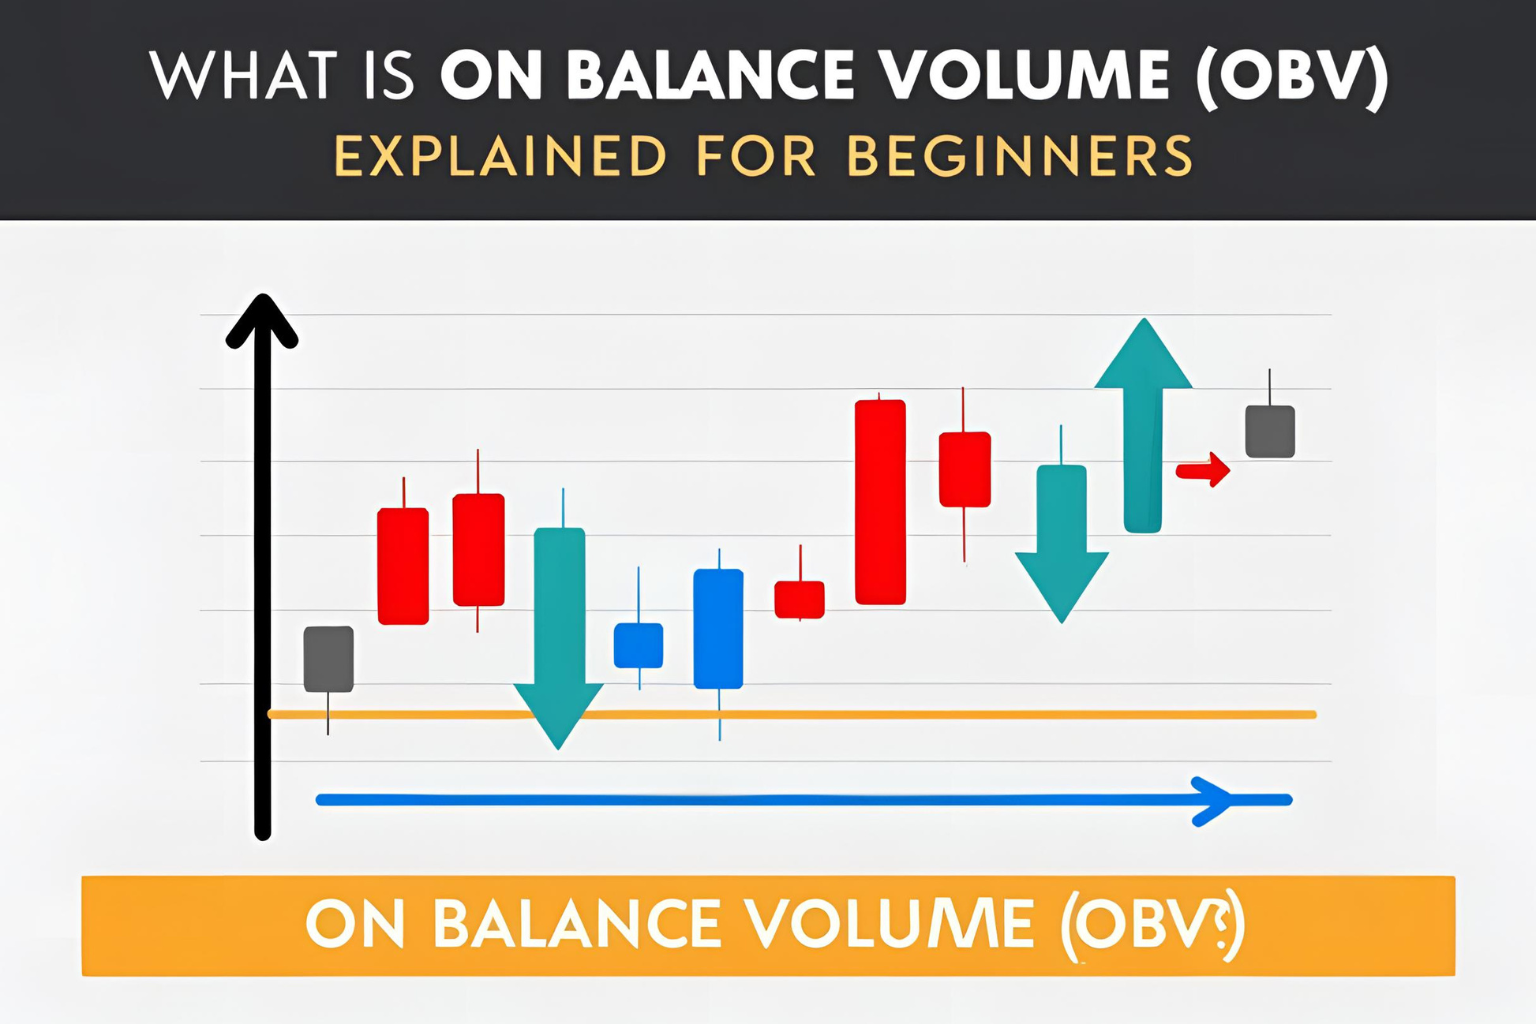
✅ OBV on a Chart (Example)
Let’s say a stock is slowly rising, but OBV is surging upward. This indicates strong buying volume, and a breakout may be imminent—even before the price explodes.
Conversely, if the stock price is rising but OBV is flat or declining, that could suggest weak participation and a possible pullback.
✅ Key Advantages of OBV
- Easy to understand
- Works well with price action and trendlines
- Helps validate volume-backed moves
- Can be applied to stocks, crypto, forex, ETFs, and more
✅ Limitations to Know
- Works best in trending markets
- May produce false signals in choppy or low-volume conditions
- Should always be used with other indicators or confirmation methods
✅ Final Thoughts
So, what is On Balance Volume (OBV)? It’s a volume-based indicator that shows the strength behind price moves. Whether you’re trading breakouts or looking for divergence, OBV can provide an edge—especially when combined with tools like RSI, trendlines, or candlestick patterns.
It’s simple, powerful, and ideal for both beginners and advanced traders alike.
✅ FAQs
1. Is On Balance Volume a leading indicator?
Yes, OBV is considered a leading indicator as it can signal moves before price reacts.
2. Can OBV be used in day trading?
Yes, especially when paired with trendlines and momentum tools.
3. What timeframe works best for OBV?
OBV works on all timeframes but is most reliable on 1-hour and higher.
4. Is OBV good for crypto or forex?
Yes. OBV is widely used in crypto, forex, and stock markets alike.
5. Can I use OBV alone?
It’s best used with other indicators or price action for confirmation.