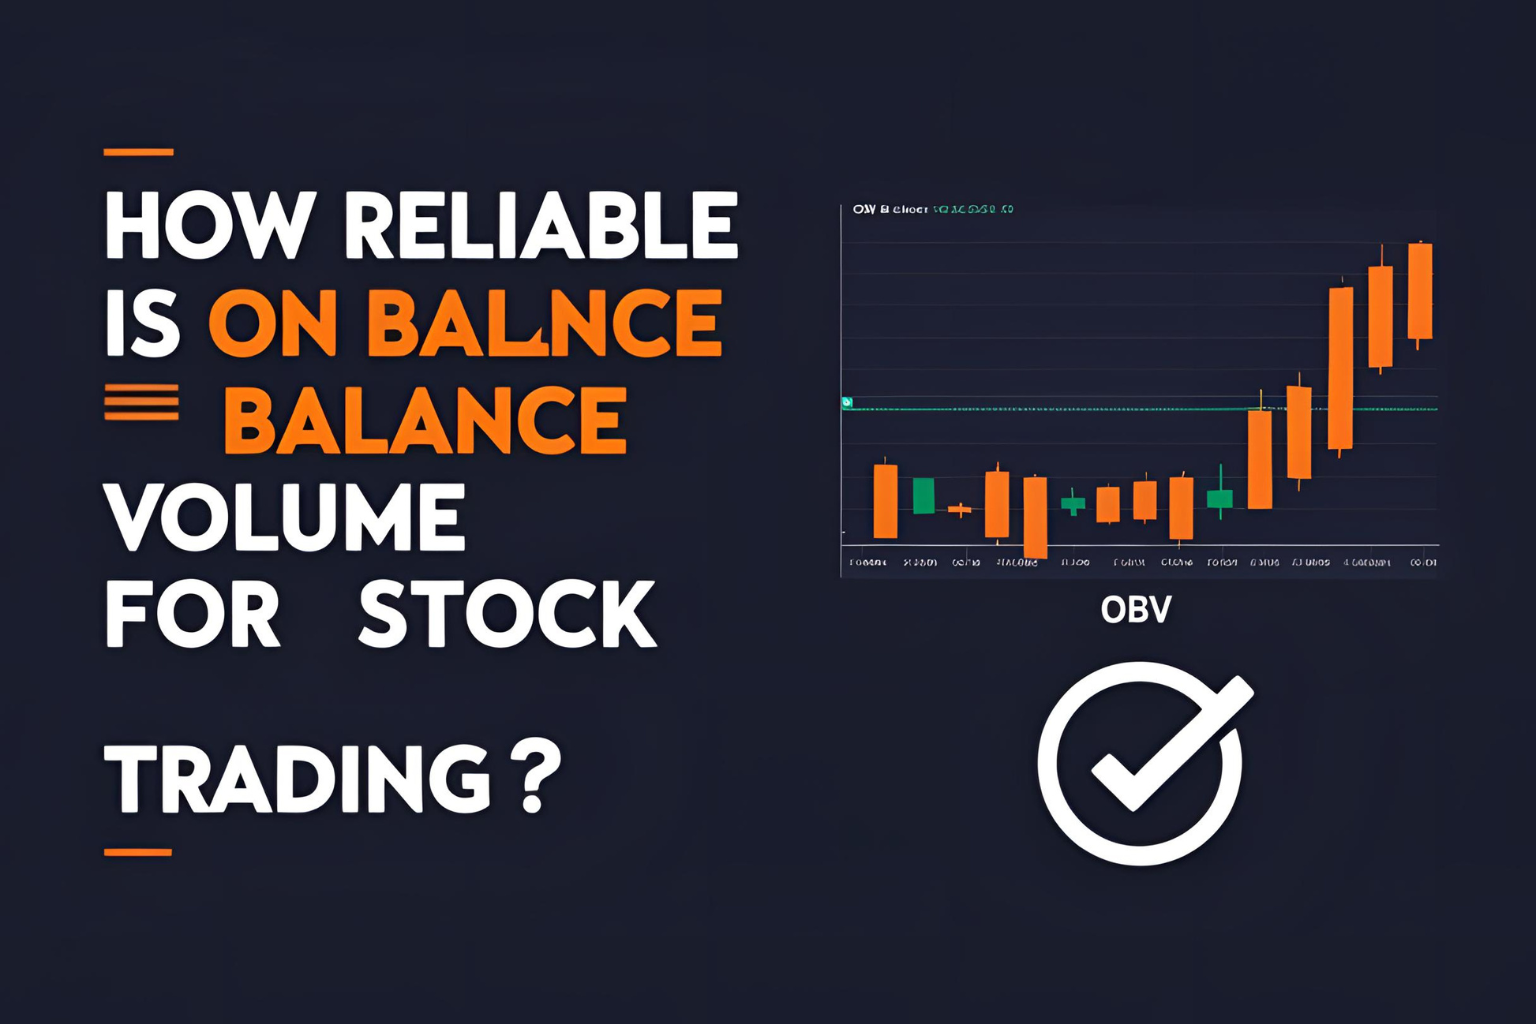
How Reliable Is On Balance Volume for Stock Trading?
The On Balance Volume (OBV) indicator has been a trusted tool among traders for decades. But many still ask: How reliable is OBV for stock trading, and should it be used alone or with other tools?
In this post, we’ll break down OBV’s accuracy, ideal use cases, and how to get the most reliable signals from it in real-world market conditions.
What Makes OBV Reliable?
OBV’s reliability comes from its core principle:
“Volume precedes price.”
OBV tracks buying and selling pressure by cumulatively adding or subtracting volume based on price direction. When OBV moves in sync with price—or diverges from it—it reveals hidden strength or weakness that can precede major moves.
When OBV Is Most Reliable
- Trending Markets
OBV excels when the market has a clear uptrend or downtrend. Rising OBV confirms strength in an uptrend, while falling OBV confirms downtrend momentum. - Breakout Confirmation
If OBV breaks above a previous high before the price does, it may signal a strong upcoming breakout. - Divergence Detection
OBV can reveal bullish or bearish divergences that warn of reversals before price reacts. - Volume-Based Validation
It helps confirm whether a price move is supported by volume—crucial for spotting false breakouts or weak rallies.
When OBV Can Be Less Reliable
- Sideways/Choppy Markets
In consolidation or low-volume zones, OBV may give inconsistent signals or appear flat. - Low-Volume Stocks
Illiquid stocks with erratic volume can distort OBV’s accuracy. - Used Alone Without Price Action
Like most indicators, OBV is best used in combination with trendlines, support/resistance, or momentum tools.
How to Increase OBV Reliability
- Use it on higher timeframes (4H, Daily, Weekly) for cleaner signals
- Combine OBV with RSI, MACD, or VWAP
- Look for confluence: when OBV and price both confirm a breakout or reversal
- Confirm OBV setups with candlestick patterns at key zones
Example of a Reliable OBV Setup
- Stock is consolidating at ₹200
- OBV breaks above previous high before price
- Price breaks ₹200 with volume
- ✅ Signal confirmed: Entry
- Stop-loss: ₹195
- Target: ₹220+
This is a classic volume-backed breakout.
Final Thoughts
So, how reliable is OBV in stock trading?
It’s highly reliable in trending markets, when combined with other tools, and when applied with proper context. OBV is a leading indicator—it can spot momentum shifts before price does, giving traders a significant edge.
To maximize OBV’s power, always pair it with price action analysis and risk management.
FAQs
1. Can OBV give false signals?
Yes, especially in sideways markets or on low-volume stocks.
2. Is OBV better than RSI or MACD?
Not better—different. OBV shows volume flow; RSI and MACD show momentum.
3. Is OBV useful for long-term investors?
Yes, OBV can help confirm institutional accumulation or distribution.
4. Does OBV work in all market conditions?
It works best in trending markets, less so in tight consolidations.
5. Should I use OBV alone?
No. Combine OBV with price structure and other indicators for the most reliable results.

