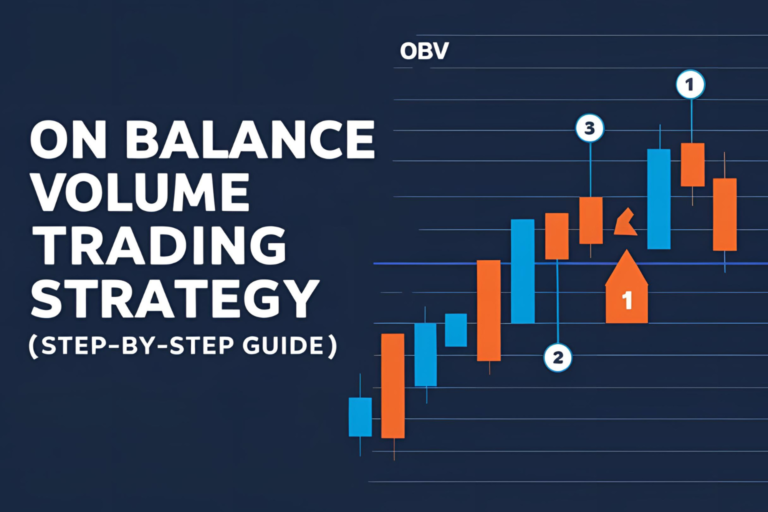
Using OBV Divergence for Early Trend Reversals
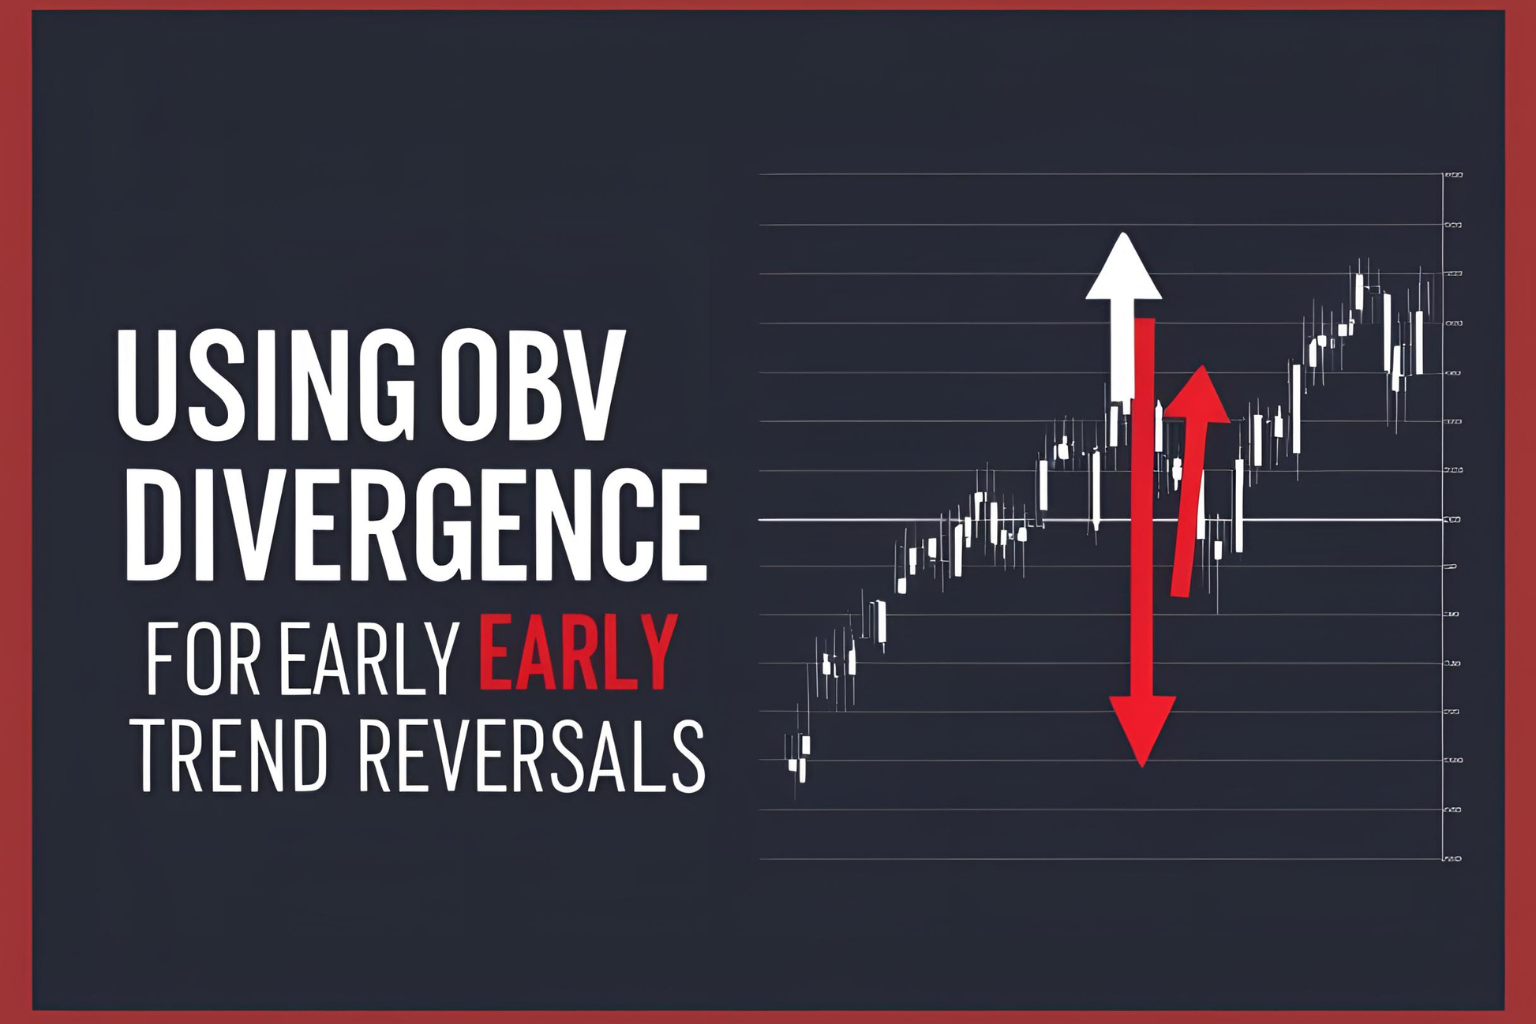
One of the most effective ways to spot trend reversals is through divergence between price and volume. The On Balance Volume (OBV) divergence strategy helps traders identify hidden accumulation or distribution before the price reacts—giving you a jumpstart on major market shifts.
This guide explains how to recognize bullish and bearish OBV divergences, with real-world examples and entry tactics.
What Is OBV Divergence?
Divergence occurs when price moves in one direction, but OBV moves in the opposite direction. This shows that the price is not fully supported by volume, and a potential reversal may be near.
Types of OBV Divergence
1. Bullish Divergence
- Price makes a lower low
- OBV makes a higher low
🟢This means buying pressure is increasing even though price is falling—suggesting an upcoming reversal to the upside.
2. Bearish Divergence
- Price makes a higher high
- OBV makes a lower high
🔴 This indicates volume is not supporting the rally, hinting at a potential breakdown.
How to Use OBV Divergence in Trading
Step 1: Add OBV to Your Chart
Available on all platforms like TradingView, MT4, and Thinkorswim.
Step 2: Identify a Clear Price Trend
- Use swing highs/lows, trendlines, or moving averages
- Look for overextended or weakening moves
Step 3: Look for Divergence
- Compare price peaks or valleys with OBV highs or lows
- Use a horizontal line or trendline to visualize the mismatch
Step 4: Wait for Confirmation
- For bullish divergence: Look for a bullish reversal candle
- For bearish divergence: Look for a bearish engulfing candle or breakdown
Optional Filter: Add RSI to confirm overbought/oversold conditions.
Step 5: Entry, Stop Loss & Target
- Entry: After reversal signal confirmed by candle or breakout
- Stop Loss: Just beyond the recent swing
- Target: Prior support/resistance or use 1:2 risk-reward ratio
✅ Real-World Example
Bearish Divergence Setup:
- Price makes a higher high at $150
- OBV makes a lower high
- Price forms a bearish engulfing candle
- Entry: $148
- Stop: $152
- Target: $138
✅ Tips for Reliable OBV Divergence
- Works best in trending markets
- Stronger signal when OBV divergence appears on higher timeframes
- Use multi-timeframe confirmation for accuracy
✅ Final Thoughts
OBV divergence is a powerful early signal that smart money is acting against the visible trend. By detecting these volume shifts before price changes direction, you can anticipate trend reversals with greater confidence.
Use OBV divergence as part of a well-rounded system including price action, confirmation candles, and risk management.
✅ FAQs
1. Is OBV divergence a leading or lagging signal?
It’s a leading signal—OBV often shifts before price reacts.
2. Can I use OBV divergence on crypto and forex?
Yes, as long as volume data is available and accurate.
3. What timeframe is best for OBV divergence?
4H and Daily charts offer strong, reliable divergence signals.
4. Should I wait for candle confirmation after divergence?
Yes, wait for a price action trigger to confirm the reversal.
5. Can divergence fail?
Yes. That’s why you should always use stop-losses and combine OBV with other tools.

