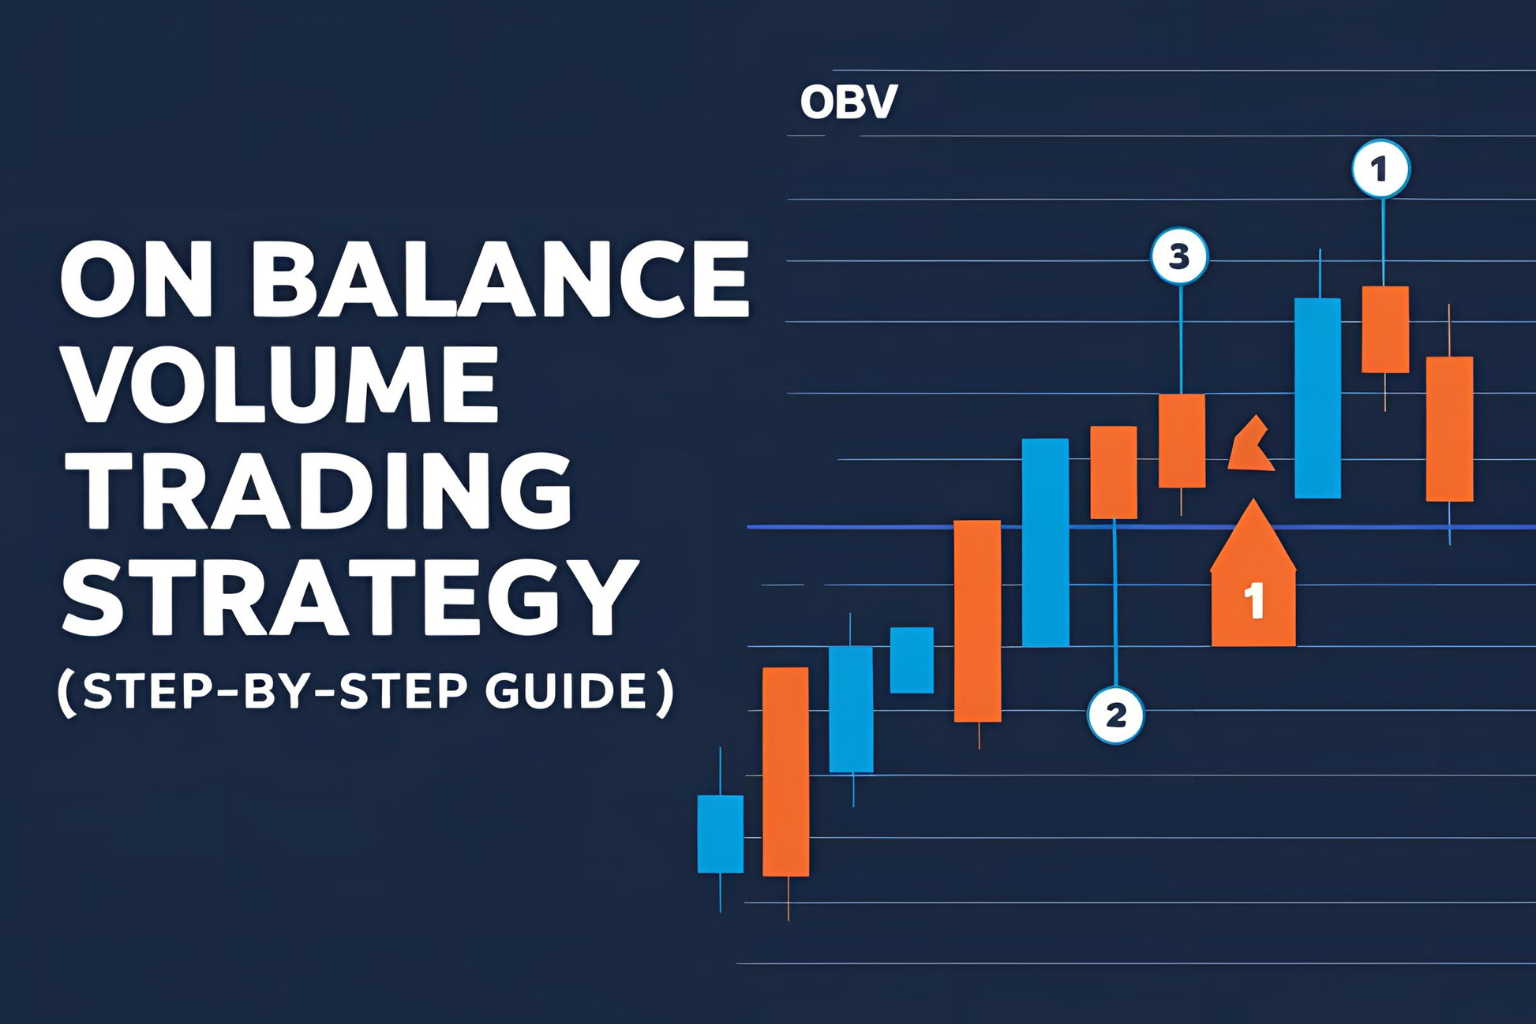
On Balance Volume Trading Strategy (Step-by-Step Guide)
The On Balance Volume (OBV) indicator offers a smart way to track momentum and volume flow, giving traders early insight into potential price movements. In this guide, you’ll learn a simple yet powerful OBV trading strategy that combines volume confirmation with trend direction—for both beginners and experienced traders.
Strategy Overview
This OBV trading strategy is built on three key elements:
- Trend direction (confirmed by price and OBV)
- Volume momentum (via OBV slope)
- Entry/exit logic (with price structure)
Step 1: Identify the Market Trend
Use price structure to determine the primary trend:
- Look for higher highs and higher lows = Uptrend
- Look for lower highs and lower lows = Downtrend
Optionally, use a 20-period EMA or trendline to confirm.
Step 2: Add the OBV Indicator to Your Chart
Most platforms (TradingView, MT4, Thinkorswim) have OBV available. Once added:
- Observe the OBV line direction
- Look for confirmation between price and OBV
✅ If price and OBV both rise → trend is supported by volume
❌ If OBV falls while price rises → possible weakness
Step 3: Wait for a Pullback or Breakout Zone
In an uptrend:
- Wait for price to pull back to support
- OBV should stay flat or continue climbing
In a downtrend:
- Wait for a lower high and OBV to drop
Step 4: Entry Signal with Confirmation
Enter when:
- Price resumes trend direction (e.g., bullish engulfing candle)
- OBV line turns up (in uptrend) or down (in downtrend)
Example:
- Price pulls back to support
- OBV stays elevated
- Bullish candle + rising OBV = Long entry
Step 5: Stop Loss & Take Profit
- Stop Loss: Just below recent swing low (for long)
- Take Profit: Use prior highs or Fibonacci extension (127.2%, 161.8%)
You can also trail the stop as OBV continues to support the trend.
Optional Filter: RSI or MACD
Use RSI (above 50 for longs) or MACD crossover as extra confirmation to reduce false signals.
Example Setup (Long Trade)
- Price: $100 → Pulls back to $95
- OBV remains strong despite price dip
- Price forms bullish candle at $96
- Entry: $96
- Stop: $93
- Target: $105
Final Thoughts
This On Balance Volume trading strategy combines price structure with volume strength to give you higher confidence in trend-based trades. OBV acts as a volume confirmation filter, helping you avoid weak trends and enter with momentum on your side.
With practice, it can become a reliable part of your technical toolkit.
FAQs
1. What timeframe is best for this OBV strategy?
Works well on 1H, 4H, and Daily charts.
2. Can I use this for intraday trading?
Yes. Just ensure there’s enough volume and clean trend structure.
3. Is this strategy better for stocks or crypto?
It works well in both, especially when volume data is reliable.
4. Should I rely only on OBV?
No—combine OBV with price action, structure, or other momentum tools.
5. Can this strategy be automated?
Yes, OBV-based strategies can be scripted in TradingView (Pine Script) or MT4/5 (MQL4/5).

