How to Read the OBV Indicator Like a Pro
The On Balance Volume (OBV) indicator is a simple yet powerful tool that tracks volume flow to reveal the strength behind price movements. But to use it effectively, you must understand how to read the OBV indicator properly—just like professional traders do.
This guide will walk you through reading OBV charts, spotting key signals, and applying OBV in real-time market conditions.
Understanding OBV at a Glance
OBV is a cumulative volume line that:
- Rises when price closes higher
- Falls when price closes lower
- Stays the same when price is unchanged
The direction and shape of the OBV line help confirm price trends, spot divergences, and detect early signs of strength or weakness.
How to Read OBV: 3 Core Signals
1. OBV Line Direction
- Rising OBV: Buying pressure is increasing. Bullish confirmation.
- Falling OBV: Selling pressure is increasing. Bearish confirmation.
- Flat OBV: Consolidation or indecision in the market.
Pro Tip: A steep OBV line means stronger momentum than a slow, gradual slope.
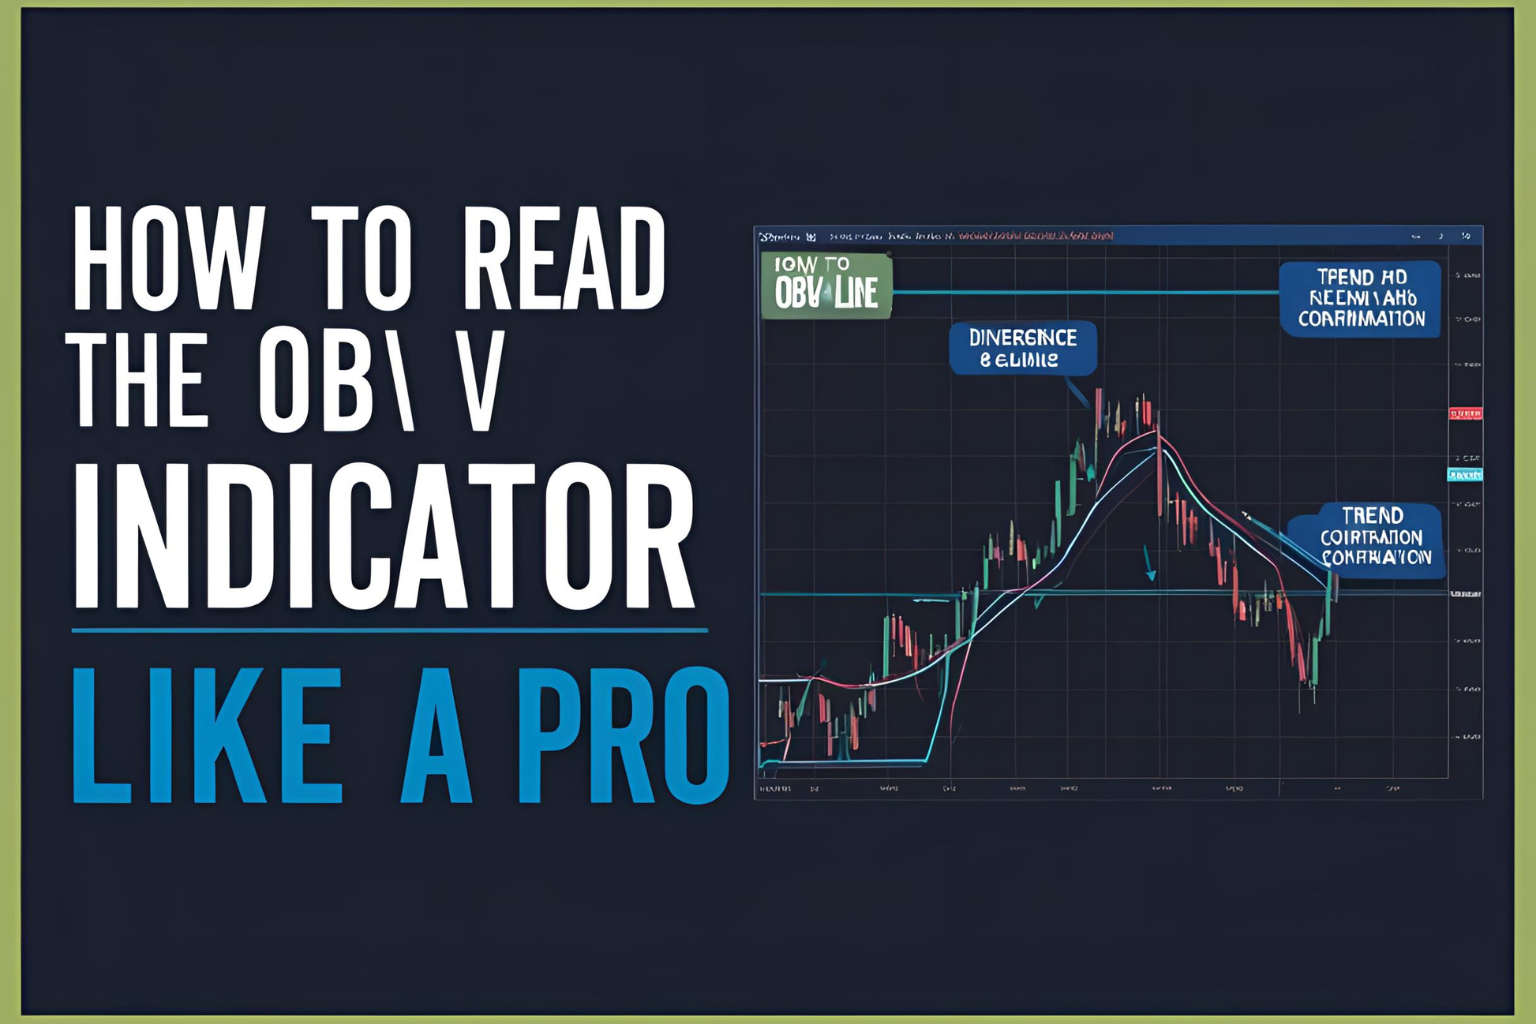
2. OBV and Price Agreement (Trend Confirmation)
When OBV moves in the same direction as the price:
- Confirms the trend is supported by volume
- Suggests higher likelihood of continuation
Example: Price rising + OBV rising = strong uptrend
3. OBV Divergence (Trend Reversal Alert)
When OBV diverges from price, it can signal an early reversal:
- Bearish Divergence: Price makes a higher high, OBV makes a lower high → Weak uptrend
- Bullish Divergence: Price makes a lower low, OBV makes a higher low → Hidden buying pressure
These are often seen before price turns, giving traders early warning.
Bonus: OBV Breakout Signal
Watch for OBV to break a previous high or low before price does. This can act as a leading signal for an upcoming price breakout or breakdown.
Example: OBV breaks resistance, but price hasn’t yet → Price may follow soon.
Best Practices for Reading OBV
- Use OBV with trendlines or moving averages
- Confirm setups with RSI, MACD, or candlestick patterns
- Avoid relying on OBV in low-volume or sideways markets
Final Thoughts
Knowing how to read the OBV indicator gives you a deeper insight into market sentiment and volume behavior. By understanding its direction, divergence, and breakout signals, you’ll be able to make more confident trading decisions—just like the pros.
FAQs
1. Is OBV better on candlestick or line charts?
OBV works best alongside candlestick charts for price action confirmation.
2. Can I use OBV alone for trading?
You can, but it’s more reliable when combined with other tools.
3. What timeframes are ideal for OBV analysis?
1H, 4H, and Daily charts offer strong OBV signals.
4. How often should I check OBV?
Check OBV during key price levels or at trend change points.
5. Does OBV work well in sideways markets?
Not really. OBV gives the best signals in trending markets.