What Does On Balance Volume Indicate in Trading?
The On Balance Volume (OBV) indicator is a powerful volume-based tool that helps traders understand what’s happening behind the price. If you’re wondering what OBV indicates in trading, the answer lies in tracking buying and selling pressure through volume flow.
This guide breaks down how OBV works and what signals it gives traders.
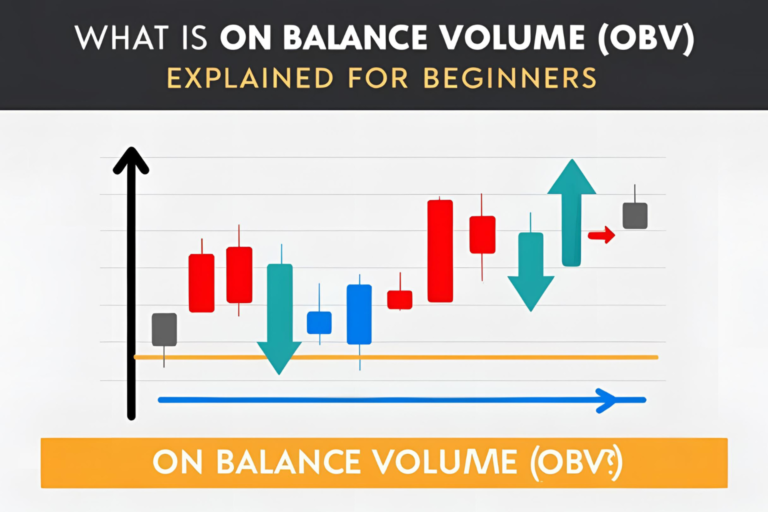
What Is OBV?
OBV stands for On Balance Volume—an indicator that adds volume when the price closes higher and subtracts volume when the price closes lower. Over time, this builds a cumulative OBV line that traders use to gauge market strength or weakness.
What OBV Indicates in Trading
Here are the three core things OBV tells you:
1. Buy or Sell Pressure (Momentum Confirmation)
- Rising OBV = Increasing buying pressure → bullish signal
- Falling OBV = Increasing selling pressure → bearish signal
When OBV moves in the same direction as price, it confirms that the trend has volume support.
2. Trend Strength
OBV is often used to confirm the validity of a trend.
- If price is rising and OBV is rising → strong uptrend
- If price is falling and OBV is falling → strong downtrend
Flat OBV in a trending market may suggest the trend is losing steam.
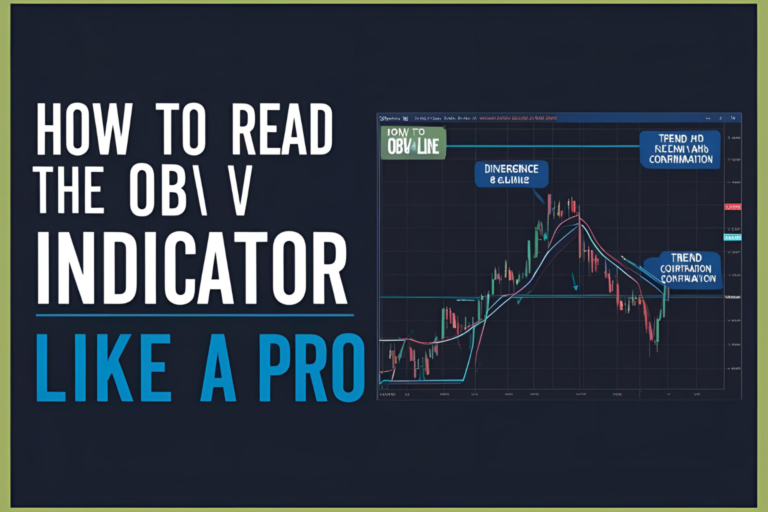
3. Bullish or Bearish Divergence
OBV can lead price by showing divergence:
- Bullish Divergence: Price makes a lower low, but OBV makes a higher low → Possible trend reversal up
- Bearish Divergence: Price makes a higher high, but OBV makes a lower high → Potential trend reversal down
This is one of the most powerful signals OBV offers.
Example Scenario
- A stock rises from $50 to $60
- OBV also rises → confirms buying interest
- Suddenly, price makes a new high, but OBV stalls
- This divergence could signal weakness, hinting at a potential pullback
When OBV Is Most Useful
- During trending markets
- When confirming breakouts or breakdowns
- As a support signal when combined with RSI or MACD
- When spotting early reversals using divergence
What OBV Does Not Show
- It doesn’t show exact entry/exit points
- OBV doesn’t account for volume spikes on gaps
- It’s less effective in sideways, low-volume markets
That’s why it’s best used alongside price patterns or other indicators.
Final Thoughts
So, what does On Balance Volume indicate in trading? It reveals whether volume is supporting or contradicting price movements. By identifying volume-based momentum and divergence, OBV helps traders make smarter, more informed decisions.
It’s a leading indicator that adds a deeper layer of insight beyond price alone.
FAQs
1. Does OBV work well with candlestick patterns?
Yes. OBV adds confirmation to patterns like engulfing candles or doji reversals.
2. Can OBV be used on all timeframes?
Yes, but it’s most reliable on 1-hour, 4-hour, and daily charts.
3. What asset classes support OBV?
Stocks, crypto, forex, futures—any asset with volume data.
4. Can OBV help confirm breakouts?
Yes. OBV rising ahead of a breakout can validate its strength.
5. Is OBV better than price action alone?
Not better—complementary. OBV reveals volume context behind price.